Housing & Demographics
WestCOG has been busy studying housing and demographics in the region lately and in response to this has created a dedicated webpage to showcase the findings and studies in this topical area.
PA 21-29 Summary
Recent changes to state law (under Public Act 21-29) necessitate all zoning regulations in Connecticut to be reviewed for compliance and potentially revised. These changes include new limits on municipal authority in the areas of housing, parking, and food businesses, as well as new mandates and expanded authority in the areas of water quality and sustainability and renewable energy. WestCOG has given a presentation these changes and will be providing further assistance in these areas in the coming months. Navigate the buttons below to view PA 21-29 and a set of slides summarizing changes for municipalities.
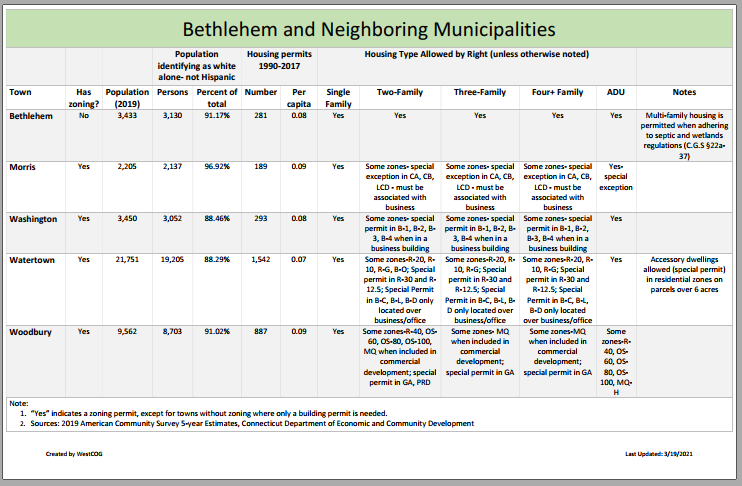
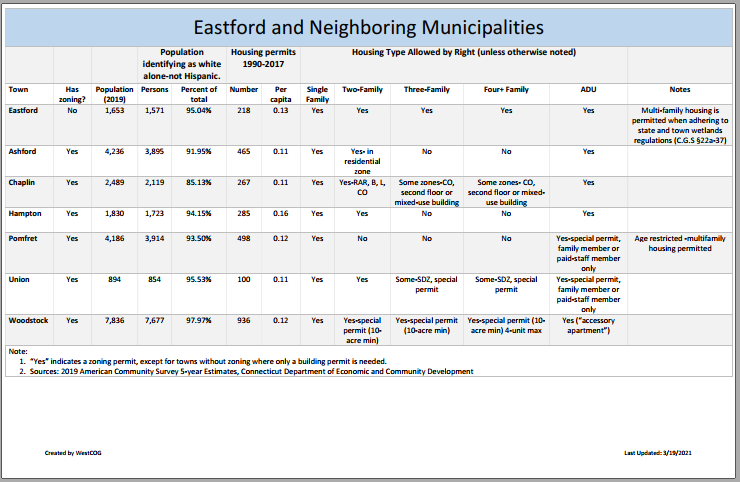
Un-zoned Municipalities vs. Neighboring Zoned Municipalities
167 out of the 169 municipalities in Connecticut have established zoning regulations as permitted under Connecticut General Statutes §8-2. To inform the ongoing discussion on how zoning regulations effect housing production and demographics, the following two tables were created to show how the unzoned municipalities of Eastford, CT and Bethlehem, CT compare with their zoned neighboring municipalities.”
State of Housing in Western CT
Housing productions varies substantially by region in Connecticut. WestCOG has produced maps and charts of recent trends in housing, including home building (total and multi-family) in the state’s regions, sizes and sales prices nationwide; and housing, household, and population statistics.

State of Housing Power Point File
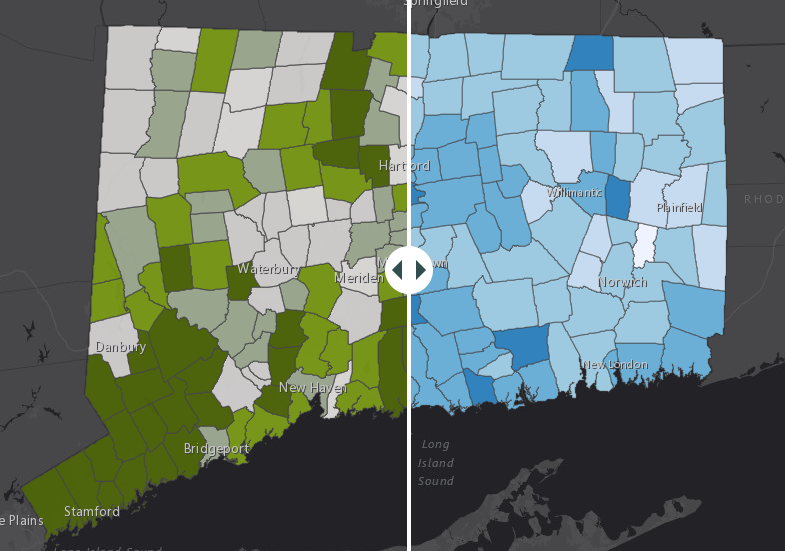
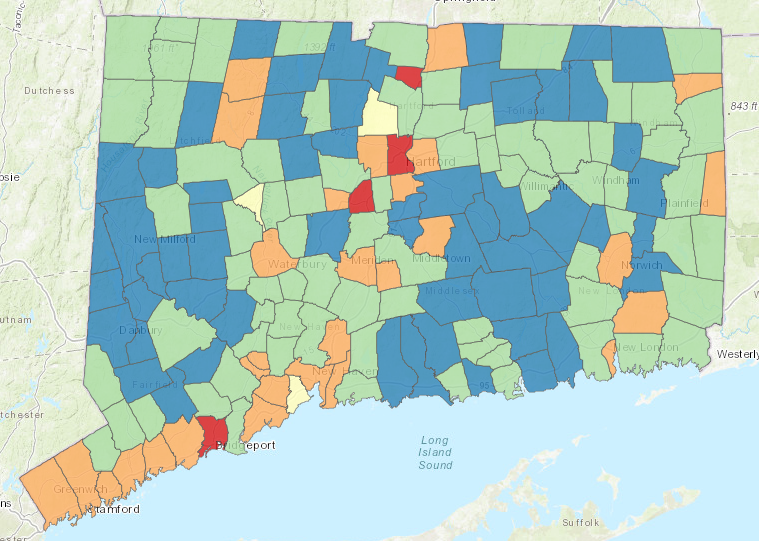
Connecticut Property Tax Burden Analysis
A brief exploration of how property tax rates and their relative burden differ across the state of Connecticut. Navigate the interactive map to compare communities median property taxes and the percentage of it against median household income for that community.
Connecticut Property Taxes Story Map
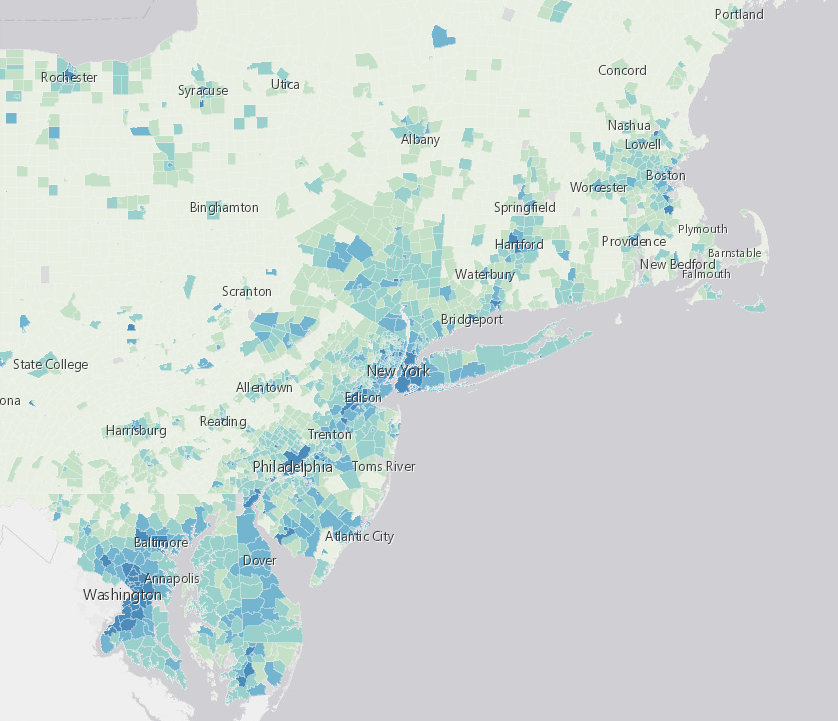
Relative Population Growth in CT from 1970 to 2019
Over the last fifty years, Connecticut has increased in population. However, this macro-level trend conceals substantial variation across time and space, with some regions and municipalities gaining people, some losing people, and some doing both (albeit in different decades). Population trends have an impact on housing: in areas that are growing, home values tend to rise, and new homes are built; in areas that are shrinking, home values tend to fall, and properties may deteriorate.
Relative Population Growth in CT from 1970 to 2019 Story Map
Residential Patterns And Trends By Race In The Northeast And The Nation
Recent events have driven a push to examine patterns and trends in household location. WestCOG is supporting this conversation with data, looking beyond the borders of Connecticut to compare the state and region to the Northeast and to metropolitan areas throughout the United States. WestCOG’s presentation draws on Census data and primarily quantitative methods.
Residential Patterns And Trends By Race – StoryMap
Affordable Housing by the Numbers
WestCOG hosted a featured presentation “Affordable Housing: By the Numbers” by Donald J. Poland, PhD, AICP. Dr. Poland shared his research and findings on the economics and polices affecting affordable housing in the state of Connecticut on July 16th, 2020.